COVID-19 - how many got infected, but never recorded as such?
We all know some friends who underwent the covid-19, without ever been officially recorded as such. We all know also that extensive testing may result close to having the actual number of the covid-19 cases. Therefore, as the data available are enriched by the tests applied to every country (from https://www.worldometers.info/coronavirus/), I did an estimation of the number of real patients from covid-19.
The countries considered are the ones with the highest number of patients (excluding china, which has not released number of tests).
Here is the status as of today:

The next chart is revealing how Germany has demonstrated an outstanding testing approach considering the rest countries.
At x-axis is the tests/pop, at y-axis is total deaths. We keep this information for later.

The basic assumption is that we will use the number of deaths as a de facto knowledge on covid-19 spread. Some deviations exist, but most deaths from covid-19 are recorded well.
The number of Patients reported from every country will be a derivative.
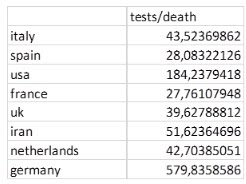
The next table shows the tests committed per total death. It is a sign of “sensitivity” of a country over the expansion stage of the virus. The highest the number, the more precise the results expected.
The next table is the diagnosis of patients per test (e.g. the inverse of tests committed per one positive case). We will keep the number of Germany for later, because it has demonstrated a high number of tests over the lowest number of deaths (see previous table).

Now it comes the first assumption. The next table shows an intermediate value of assumed tests done at the rate of Germany. Why Germany? From the above results, we will use Germany as a model country for doing much in an early stage of the virus (which has also the lowest coverage, as we will see in a following table). The formula for the following table is Population_Country X (tests_GER/Population_GER).

Note that the above number of assumed tests does not take into account the stage on which the testing takes place. We will adjust the above value by using the following two tables. The first table shows the deaths/population for each country. I call this “tolerance”. It corresponds to a de facto social pressure.

Then, for each country, we will calculate their “relative tolerance”, their ratio as above over the ratio in Germany. It shows the magnification of the consequences of covid-19 in a country, over Germany’s one, when late/limited testing is applied - it is used as a "temporal" adjuster (disclaimer: some countries went early in the game, and no knowledge on extensive testing existed, but still, the ratio reflects the temporal magnitude). In other words, the following value transforms any country into a "German-minded" one, in terms of the virus testing. The table is as follows:

We will then multiply the above values with the intermediate assumed tests, to calculate how many tests would have been committed if the sensitivity was the one of Germany.

Now, you remember the table above, termed “diagnosis of patients per test”? We will use the value of Germany to calculate the number of patients. This assumes that if a country had done tests at the pace of Germany, they would have achieved the same rate of diagnosis. Note that Germany has the lowest value, e.g. the most tests per patient. I repeat that table for convenience here:

If we multiply the “assumed tests per sensitivity” table, with the value of Germany for “diagnoses: patients/test”, we get the following estimate for the actual number of patients per country, i.e. including cases which have never been tested. I include also the patients recorded. Note that, again, the calculation assumes Germany being “ideal”, as the calculation produces a number equal the reported number of patients in Germany, i.e. if we assume that Germany “loses” patients, these values should be higher for all (but unfortunately, I haven’t any idea to calculate how much). Also, another factor that messes up real patient data are the different policies applied. Being just a model estimate, the next table does not aim but capture the effect created by late/limited testing on a country. The first column is my estimation on actual cases (equals to "patients out there" + recorded), the second column is what is recorded as of today.

Notes:
- Germany is selected as "clean" case for the following reasons:
- Extensive testing in absolute values ,only second to US
- Extensive testing in relative to population values, only second to Italy
- Lowest patients/tests, allows considering a "limit" on diagnosing
- Lowest "tolerance" (see above), allows for estimation due to "scientific" interest, rather than as a consequence of social pressure.
- The above factors present Germany as the most "clean" case. The more "dirty" you consider Germany (e.g. inaccurate in estimating the real number of patients), the worse scores are assumed for the rest countries.
- I received feedback by an Iranian friend that the reported number of deaths is much lower than the real one. I promised to check on their time series data, and try to spot any faking (by comparing with other countries). To be continued, there...
Conclusion
This is a model on how much could have been revealed to other countries, should they have used the approach of Germany. It is not a blame game, as late knowledge was available for Germany to take measures, but only to give an idea on a potential number of positive covid-19 cases, based on the present number of deaths.
PS. Some people insist on believing that in Germany the low death scores are because "it is the young people who get the disease". Really? Have you thought maybe that the many deaths in Italy in contrast, could be an outcome of many-many more cases who have never been reported?